|
Overview |
  
|
|
Overview |
|
Trend is a graph of the values of variables versus time.
The Trend function allow monitoring channels, which means it is possible to monitor variables and/or parameters at the same time.
Below is an overview of the trend function configuration screen.
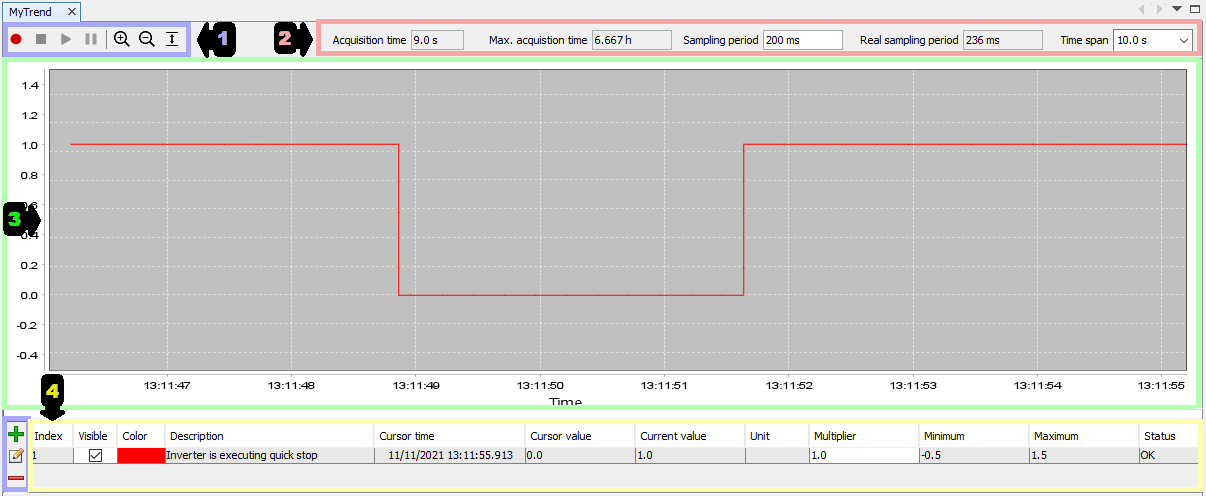
| 1. | Channels, Start, Stop, Pause and Graphic Zoom: This bar contains the options to control the chart, such as zoom in, zoom out, set width, set height and set all. There are buttons to start, pause or stop data acquisition. |
| 2. | Time: This bar contains the options to configure the sampling periods and time range to be shown on the graphic. |
| 3. | Chart: This screen shows graphically the monitored values of the channels. In the lower part is the time of collection, and on the left is the range of values per unit of measurement of the channels. |
| 4. | Channel Table: This table shows the data of the chosen channels in the position where the cursor is, besides the possibility to hide channels (Visible), change the channel color (Color) and set the chart limits per unit of measurement (Maximum) and also the options to add, edit and remove channels. |